
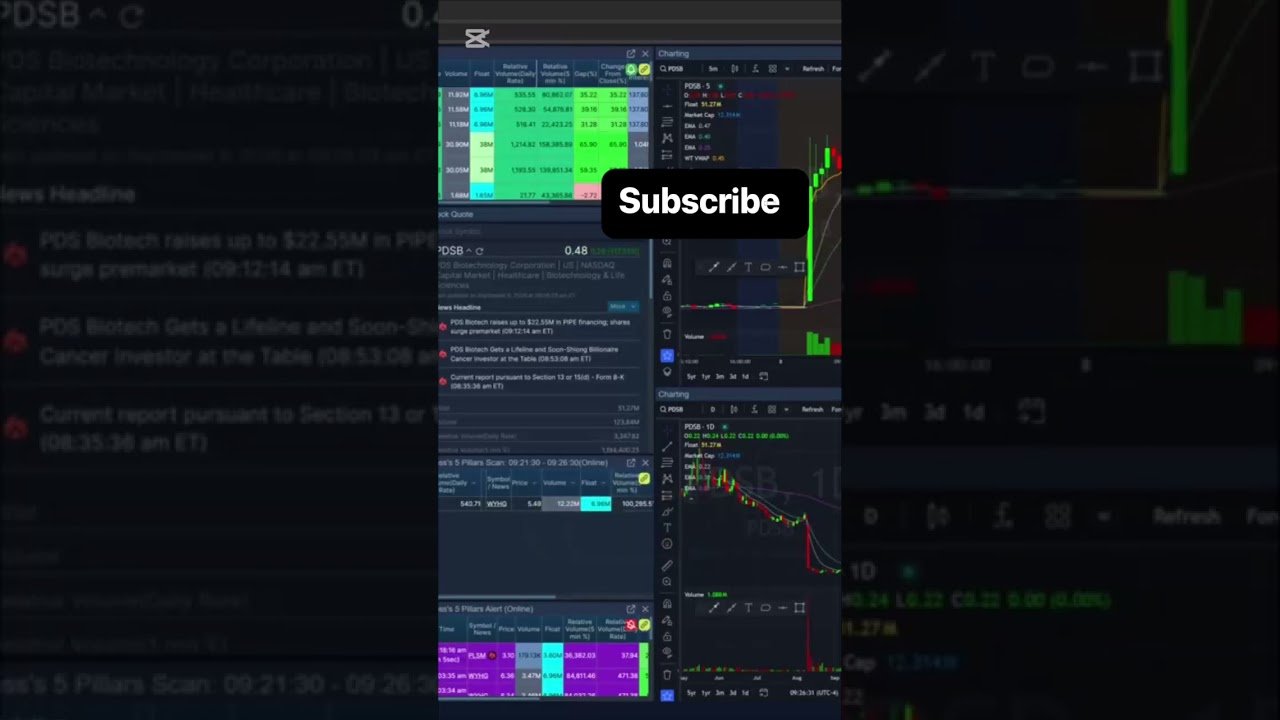
Ever look at a stock chart and think, “There’s no way that move is normal”? Here’s what could be happening.
Unusual price patterns can develop when volume suddenly changes, liquidity gets thin, news hits, institutions reposition, or traders react strongly to a catalyst. When buying and selling pressure becomes unbalanced, price can move in ways that look completely different from the stock’s normal behavior.
Email me through the link in my bio to learn more about joining the community.
Unusual stock patterns usually have a reason. Watch volume, liquidity & catalysts. 📊👀 #Stocks #Trading #DayTrading
When I spot an unusual pattern on a chart, I don’t immediately assume it’s a signal to buy or sell. I first look at what changed. Volume, liquidity, news, market conditions, and order flow can all influence how a stock moves. Sometimes the pattern reflects genuine momentum, while other times it can simply be temporary volatility. Understanding what’s happening beneath the chart helps me make more informed trading decisions instead of reacting emotionally to unusual price action.